Visualizing Embedding Spaces
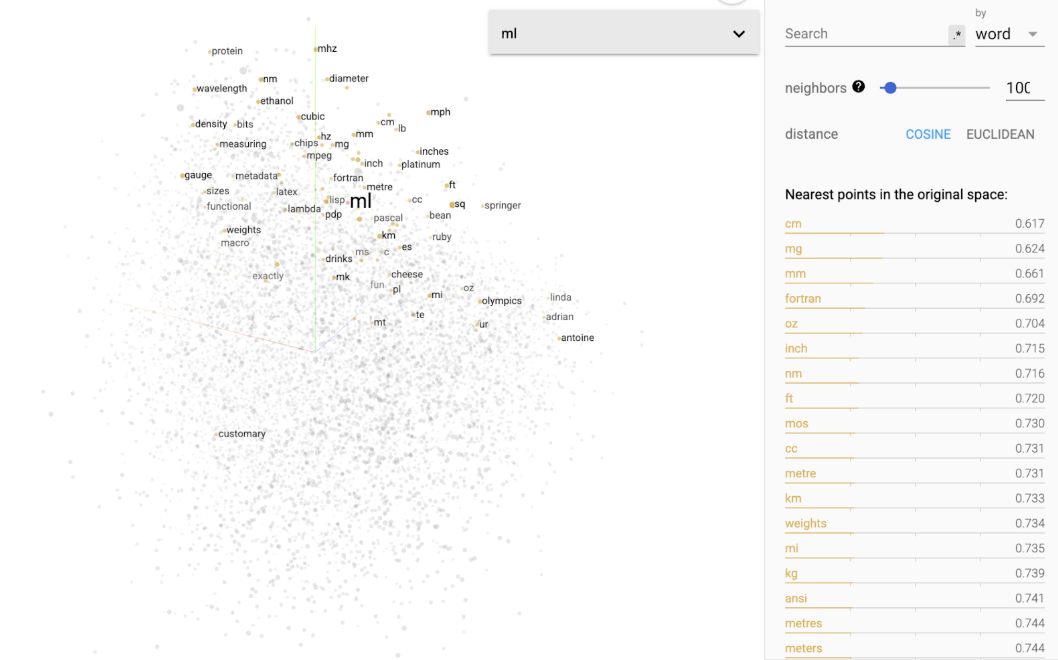
Modern embeddings have hundreds or thousands of dimensions. You can't visualize that. So we reduce.
The standard approaches:
- PCA (Principal Component Analysis): linear. Captures global linear relationships. Fast. Use it when you want to find the major axes of variation in your data.
- t-SNE: nonlinear. Constructs a low-dimensional representation where locally similar points stay close together. Good for revealing clusters. Distances in the t-SNE plot don't preserve global structure — two clusters that look far apart may not be far apart in the original space.
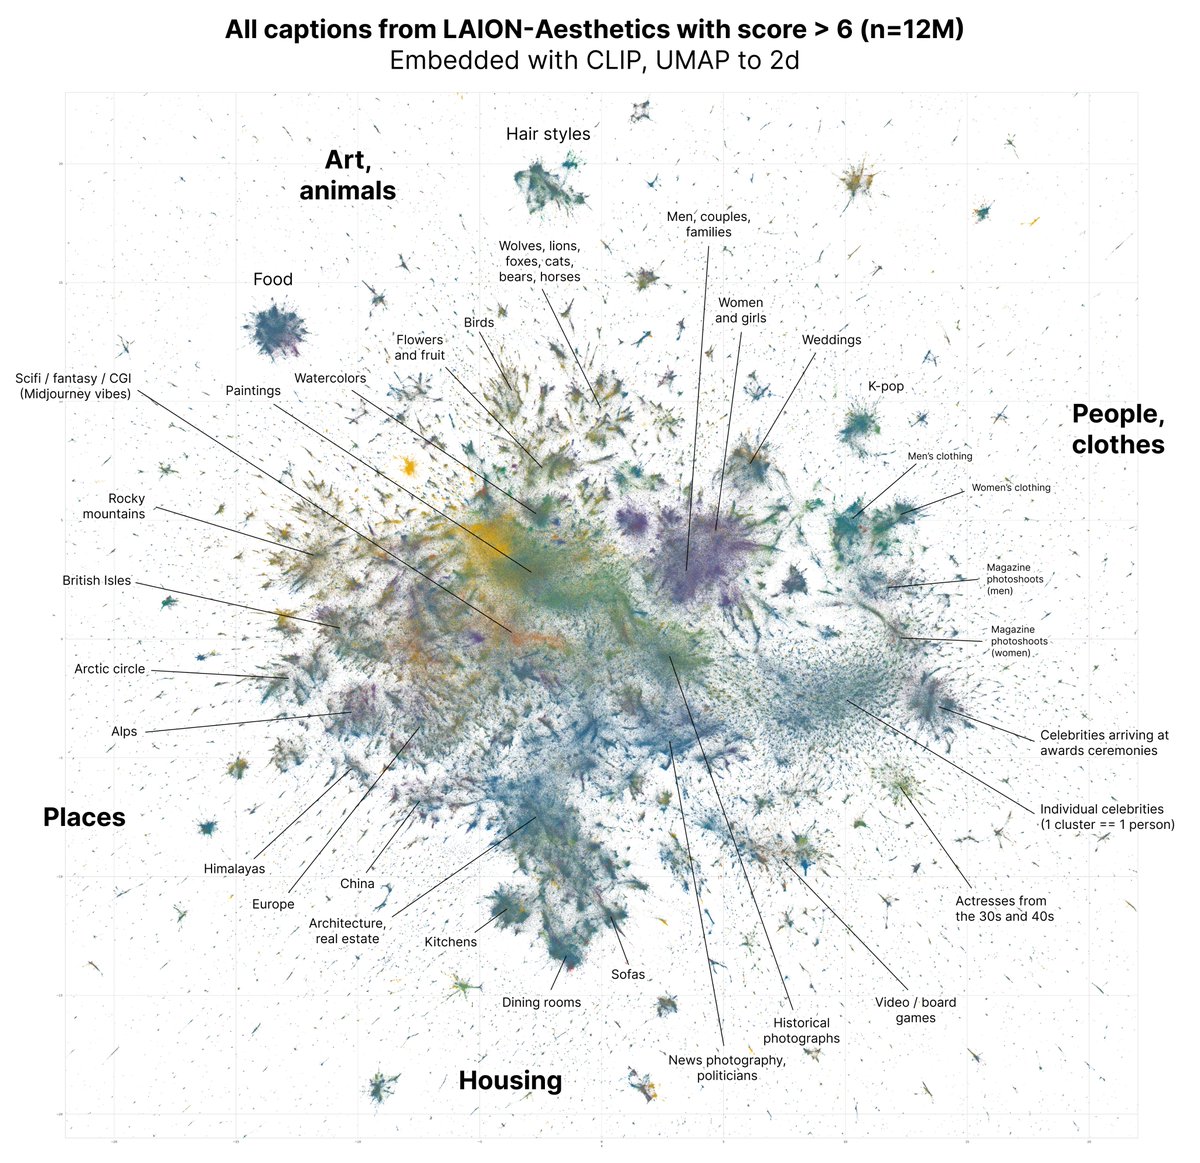
- UMAP: nonlinear, based on manifold learning. Similar goals to t-SNE but typically faster and better at preserving some global structure too.
For large embedding spaces where you want to see clusters and local relationships, prefer t-SNE or UMAP over PCA.