Anchor Boxes and Non-Maximum Suppression
The Anchor Box Problem
Here is the challenge in bounding box detection: objects come in wildly different sizes, shapes, and positions. A naive approach might slide a fixed-size window across every position in the image. But what size window? A window sized for a distant pedestrian will miss a nearby truck, and vice versa.
The solution is anchor boxes: a predefined set of boxes with different sizes and aspect ratios, placed at every position in the image. The model does not predict bounding boxes from scratch — it predicts offsets (adjustments to x, y, width, and height) relative to each anchor box. This is a more tractable prediction problem.

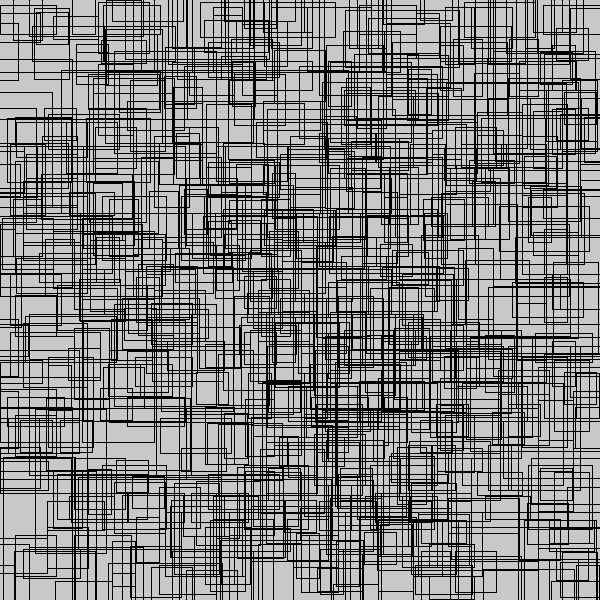
Anchor boxes: multiple candidate boxes of varied sizes converge onto the detected subject. The model predicts offsets from these anchors rather than absolute coordinates.
A typical detection network might use thousands of anchor boxes per image. That raises a new problem: how do you deal with all those predictions?
Non-Maximum Suppression: Keeping the Best Boxes
When a model generates thousands of anchor box predictions, two things happen: many boxes will have very low confidence (nothing detected), and many remaining boxes will overlap heavily (multiple anchors detecting the same object from slightly different positions).
Non-Maximum Suppression (NMS) handles both:
- Remove all boxes with confidence below a threshold (e.g., 80%).
- For the remaining boxes, calculate Intersection over Union (IoU) between every pair.
- When two boxes have IoU above a threshold — they are clearly detecting the same object — keep only the one with higher confidence and discard the other.
Intersection over Union is the area of overlap between two boxes divided by the area of their union. An IoU of 1.0 means perfect overlap. An IoU near 0 means the boxes barely share any space.
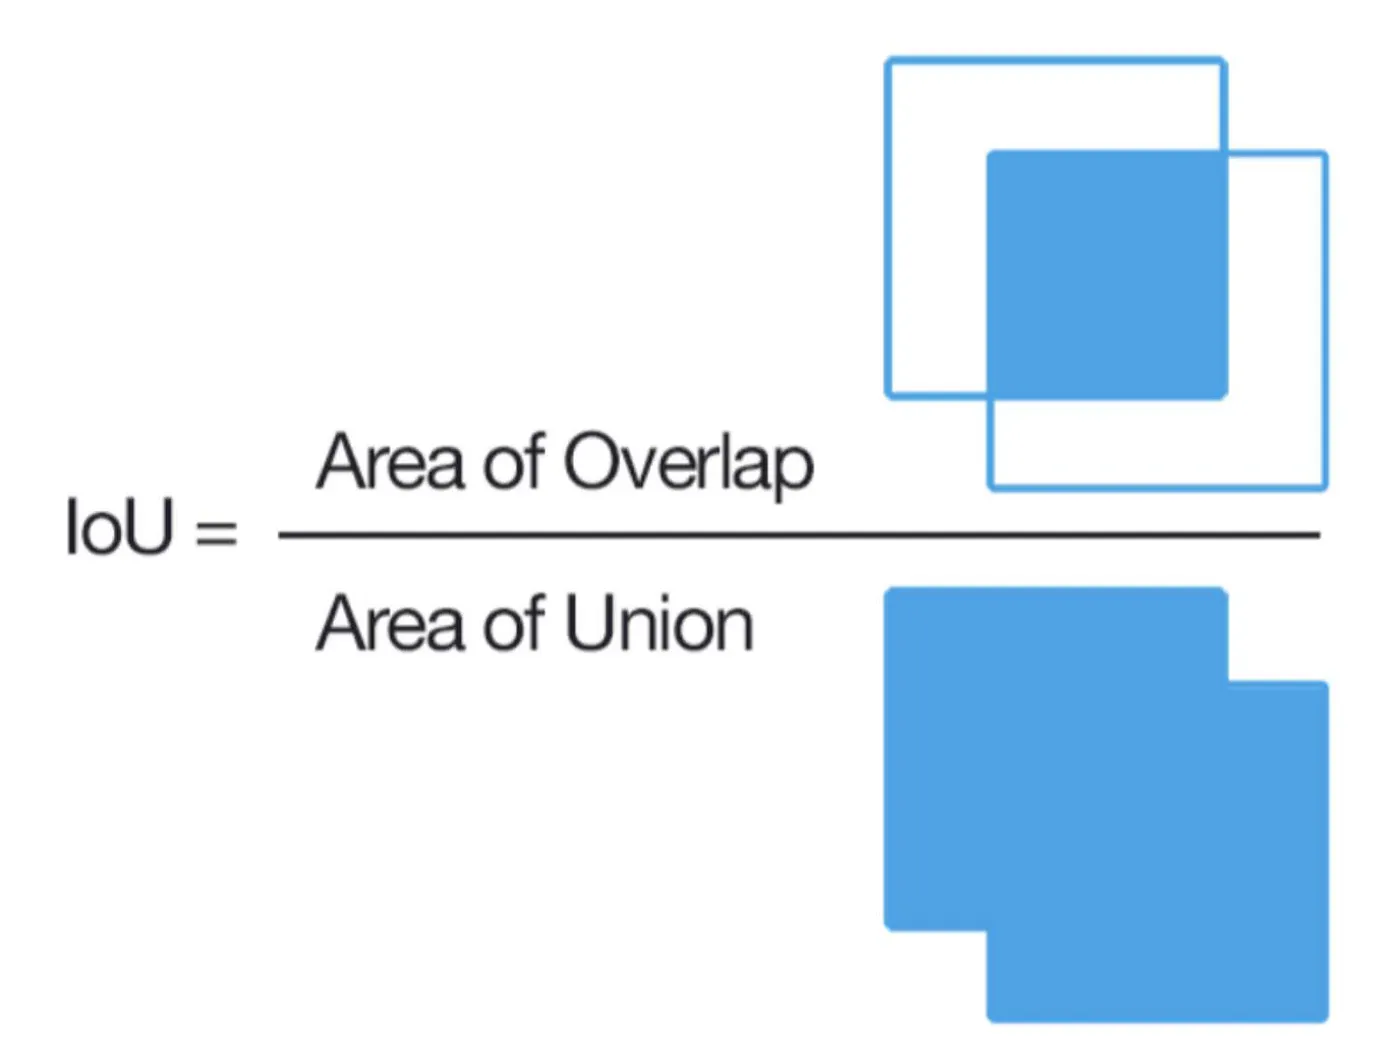
Drag boxes to move · drag the corner dot to resize
Drag two bounding boxes on the canvas. The panel shows the intersection area, union area, and IoU score in real time. Experiment with overlapping and non-overlapping configurations.
A detection model produces three overlapping boxes for what appears to be a single pedestrian. Their confidence scores are 0.92, 0.87, and 0.79. Their IoU values are all above 0.6. After applying NMS with a confidence threshold of 0.80 and an IoU threshold of 0.5, what is the result?